
Presenting Polling Data to Stakeholders: A Practical Guide

A headline number can command a room and still point stakeholders toward the wrong decision. Learning how to present polling data to stakeholders means showing more than the topline: the evidence, the context behind it, and what it can reasonably support. Dense charts can hide the central finding, while treating a poll result as a definitive prediction can create false certainty.
Stakeholders bring different priorities and different levels of research experience, so a presentation must be clear without oversimplifying the evidence or obscuring its limitations. Polling is most useful as decision support: a snapshot of public opinion that leaders can interpret alongside their strategic goals.
This guide explains how to build a credible, decision-focused presentation. You’ll learn to foreground the core finding, explain methodology and uncertainty, tailor the framing to varied audiences without changing the facts, and close with implications and a practical next step. The aim is not simply to display results, but to help stakeholders understand what the poll says, what it doesn’t say, and which decision the evidence can inform.
Table of Contents
Why presenting polling data to stakeholders takes more than showing the topline
A topline percentage answers a particular survey question; it is not a complete strategy. A stakeholder-ready presentation puts that result alongside the exact question, relevant context, and an explanation of what the evidence may mean for a decision. This distinction matters in public affairs, where leaders may be weighing communications, campaign priorities, or how to allocate limited resources.
A decision-focused polling presentation organizes evidence, context, and implications to help a defined group make a specific choice. That approach keeps the presentation accountable to both the research and the people responsible for acting on it. A useful overview of the purpose and limitations of Opinion Polls can also help explain why results must be understood in light of how the poll was designed.
A single overall result can conceal differences that matter. For example, if a hypothetical poll finds broad support for a proposal, that topline alone won’t show whether support varies across relevant groups or which aspect of the proposal respondents were asked to consider. Those details can change how stakeholders understand the finding. The aim of how to present polling data to stakeholders is not to make a result sound stronger; it is to make its meaning and boundaries clear.
Start with the decision stakeholders need to make
Name the pending decision before displaying results. Is the group choosing which public concern to address in a message, deciding whether to adjust a campaign priority, or weighing where to direct resources? Then identify who needs the findings and what authority that audience holds. Decision-makers may need a concise account of trade-offs, while staff responsible for implementation may need to understand how the evidence informs execution. SMG’s public opinion polling services provide context on using research for strategic intelligence.
Separate the finding from its interpretation
Make it easy to distinguish what respondents said from what the research team believes the response may imply. Label survey results, analysis, and recommendations separately. For instance, a stated preference is evidence of opinion at the time of the poll; it is not proof that respondents will act on that preference later. Avoid turning an association into a cause or a snapshot into a forecast.
This separation protects both the evidence and the decision. If stakeholders disagree with an interpretation, they can examine the reasoning without disputing the underlying result. Polling informs judgment; it doesn’t make a decision on stakeholders’ behalf. A credible presentation supports that judgment by explaining the question asked, stating what the result supports, and identifying what remains uncertain.
Build a polling-data presentation around evidence, context, and implications
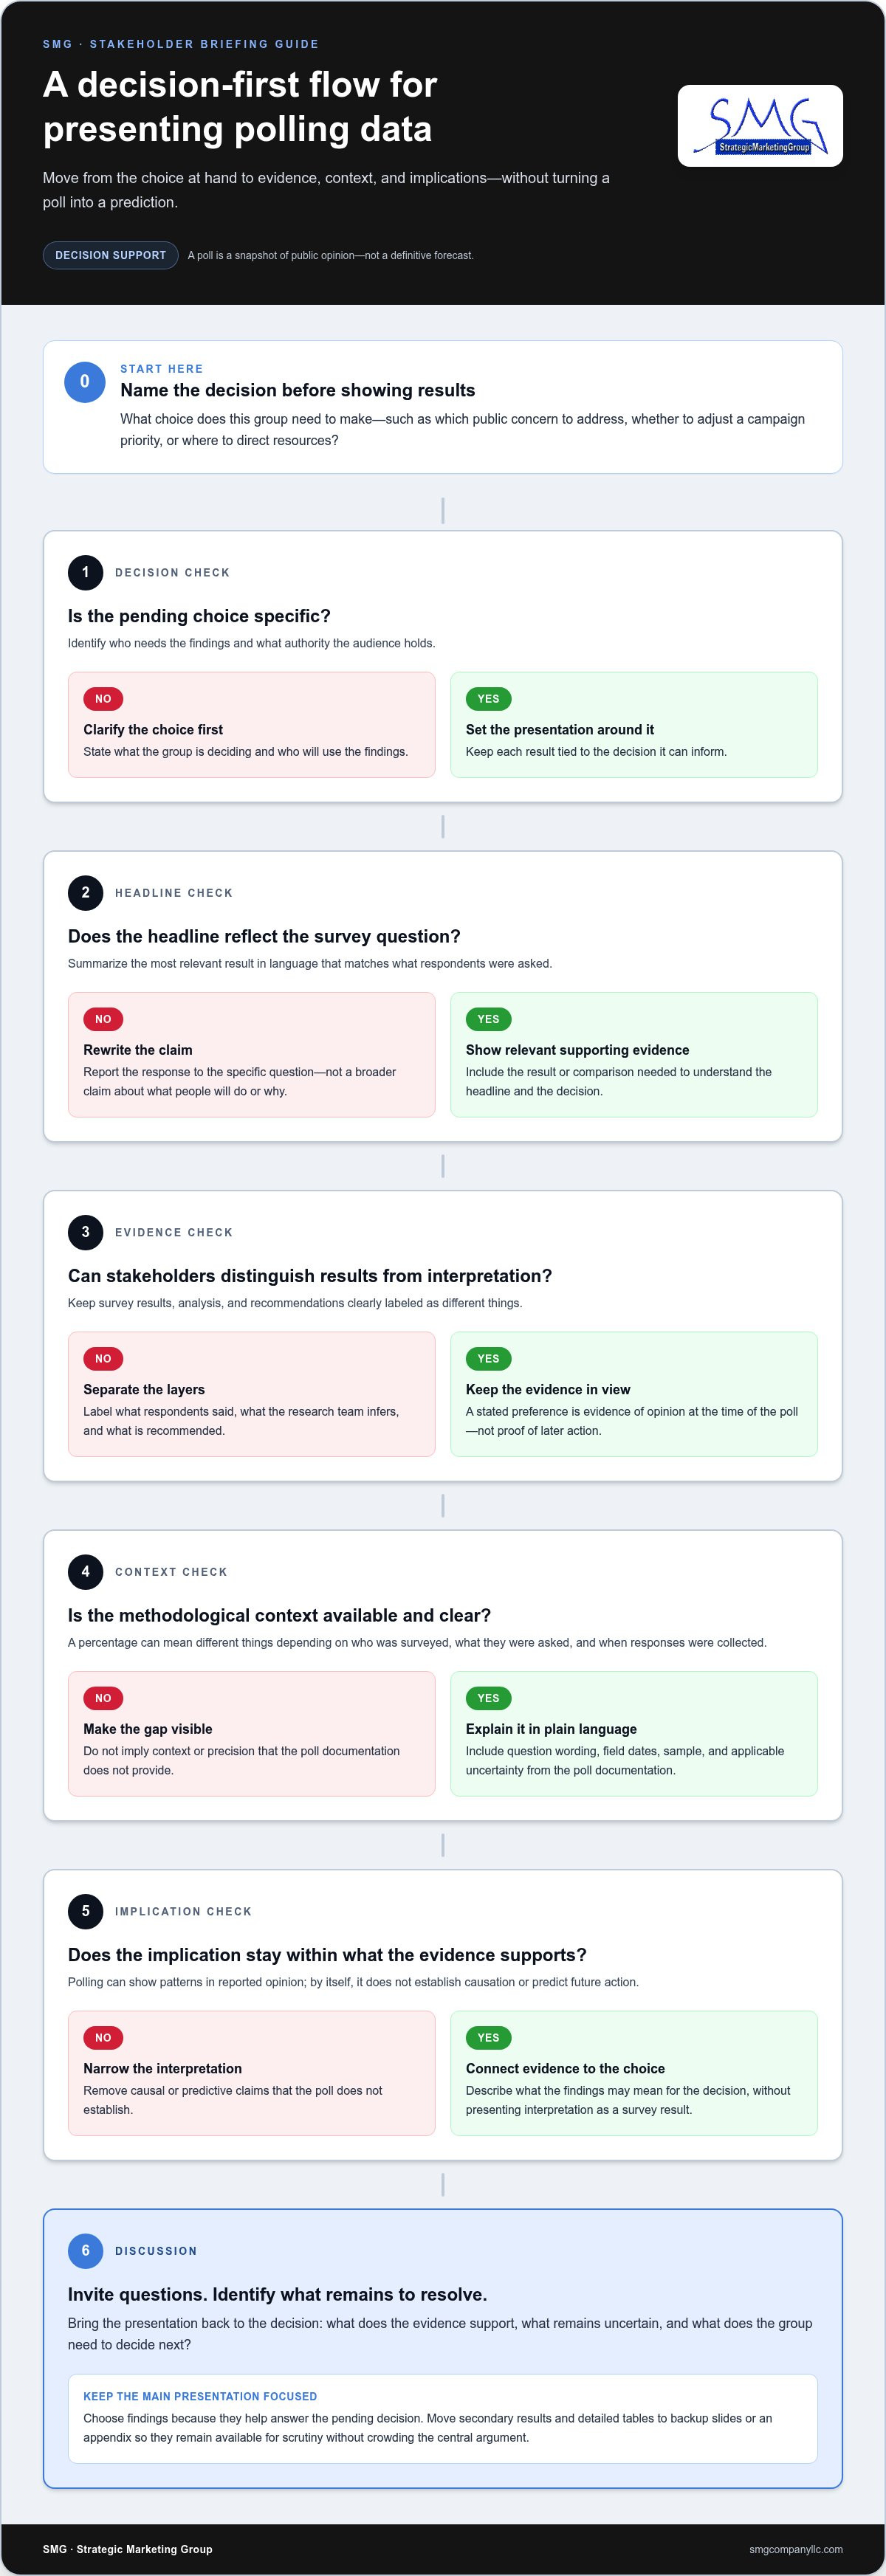
A disciplined structure helps stakeholders move from results to a sound decision without losing sight of how the findings were produced. For how to present polling data to stakeholders, use a repeatable sequence that keeps the poll’s evidence and limits in view:
Decision: State the choice the group needs to make.
Headline finding: Summarize the most relevant result in language that reflects the survey question.
Relevant evidence: Show the supporting result or comparison needed to understand that finding.
Context: Explain the question wording, field dates, sample, and applicable uncertainty using the poll’s documentation.
Implication: Describe what the evidence may mean for the decision, without presenting interpretation as a survey result.
Discussion: Invite questions and identify what the group needs to resolve or decide next.
Methodological context matters because the same percentage can mean different things depending on who was surveyed, what they were asked, and when responses were collected. Without that context, stakeholders can easily overread a finding.
Keep the central claim faithful to the question and the responses. If respondents were asked whether they support a specific proposal, report support for that proposal as worded. Don’t turn the result into a claim about what people will do or why they hold that view. A poll can show patterns in reported opinion; it doesn’t, by itself, establish causation.
Select the few findings that change the discussion
Choose results because they help answer the pending decision, not simply because they are the largest number or the most striking chart. Include comparisons only when they clarify a meaningful difference or help explain the headline. For example, if stakeholders are deciding how to frame a public message, a relevant contrast in responses may sharpen the discussion; an unrelated breakdown may distract from it.
Move secondary results and detailed tables to backup slides or an appendix. They remain available for questions without competing with the main argument. A focused presentation doesn’t hide evidence; it separates the results needed for the decision from additional detail that supports scrutiny.
Explain uncertainty without weakening the evidence
Use the poll’s documentation to describe the sample, fieldwork dates, and any stated measure of uncertainty. Explain those details in plain language. Don’t supply a margin of error, confidence interval, or other precision estimate unless the research documentation supports it and it applies to the result being discussed.
Take particular care with subgroup findings. If subgroup sizes or the research design limit interpretation, say so rather than presenting small differences as firm conclusions. Clear caveats strengthen the presentation by showing stakeholders where the evidence is informative and where judgment is still required. For organizations connecting polling to public-affairs strategy, SMG’s polling and data analysis can support that work.
Choose polling visuals and formats that fit each stakeholder audience
The right format depends on what stakeholders need to understand and do with the findings. A short executive briefing can focus on the decision and a few consequential results. A full presentation can provide room for methodology, comparisons, and discussion. A written follow-up gives participants a concise record they can revisit. Effective how to present polling data to stakeholders practice matches the depth and detail to the audience without changing the underlying evidence.
Format
Best suited to
Strength and limitation
Executive briefing
Leaders facing a near-term strategic choice
Surfaces key implications quickly, but leaves little space for technical detail.
Full presentation
A group that needs to examine findings and discuss trade-offs
Allows more context and questions, but can lose focus if every result receives equal attention.
Written follow-up
Participants who need a reference after the meeting
Preserves definitions, sources, and caveats, but can’t replace live discussion.
Formats can work together: present the central finding in the meeting, then circulate a written summary with supporting detail and the documented methodology. Keep the summary faithful to what respondents were asked and how they answered.
Adapt emphasis for campaign, public-affairs, and civic stakeholders
Campaign leaders may need to understand the strategic implications of public sentiment without claiming that a poll predicts future behavior. Public-affairs audiences may need policy context to assess what a response says about an issue or proposal. Civic stakeholders may focus on whose perspectives are represented and what questions remain. Broader audience patterns can inform electorate analysis without requiring every presentation to reproduce the full methodology.
Make polling charts easy to interpret at a glance
Give each chart one clear takeaway and label the measure plainly. Use a bar chart to compare response categories or groups, a stacked bar to show how answers make up a whole, and a line chart to show change across comparable measures and time points. Match the chart type to the question; don’t imply a trend if the measures aren’t comparable.
Use consistent scales, readable labels, and annotations that clarify the question or sample. Avoid truncated axes that exaggerate differences, decorative effects that compete with the data, and crowded legends. Add a visible source note with the poll name or sponsor and relevant field dates. Show subgroup comparisons only when the underlying data supports a responsible reading, and avoid displaying more precision than the research justifies.
Handle stakeholder questions, disagreement, and next steps with discipline
Questions are part of a sound polling discussion. Prepare concise answers grounded in the study documentation: what was asked, who was surveyed, when fieldwork took place, how the sample was constructed, and what uncertainty or limitations apply. If a detail isn’t in the documentation, don’t guess. Distinguish factual clarification from interpretation or a decision the group still needs to make.
When a result is challenged, return to the evidence, its limits, and the decision it can inform. This keeps the discussion constructive without dismissing concerns or changing what the poll actually found. It’s a practical discipline at the heart of how to present polling data to stakeholders.
Respond when results challenge stakeholder assumptions
Start by asking which specific finding, wording, or interpretation concerns the stakeholder. Then revisit the relevant details in the record: the question wording, the population surveyed, field dates, and any applicable uncertainty. A concern about whether a question reflects a real-world issue differs from a concern about how the result was interpreted. Clarify the issue before responding.
Don’t select only the results that support an existing position or dismiss a finding because it conflicts with expectations. If stakeholders raise new context, identify it as context for deliberation, not as a change to the survey evidence. Where interpretation remains contested, state what the results show, what they don’t establish, and what additional information could help the group assess the implications.
Close with decisions, owners, and follow-up
Before ending, summarize what the group has decided, which options remain under consideration, and which questions are unresolved. Turn agreed follow-up into clear assignments: name an owner and timeframe for each action, such as reviewing a message or bringing a policy question back for discussion. Avoid leaving the room with a general intention to “revisit the findings” and no defined responsibility.
Send a concise written summary after the meeting. Record the key results, the caveats that shaped interpretation, the decision or open choices, and agreed actions. Keep the summary aligned with the poll and the discussion; don’t turn a cautious interpretation into a definitive claim after the fact. A consistent written record helps stakeholders carry the same understanding into subsequent decisions.
When polling results raise strategic questions, structured research and analysis can help decision-makers assess the evidence and determine what to examine next. Explore SMG’s public opinion polling capabilities to support that work.
Turn polling results into strategic communication with SMG
Research becomes strategically useful when decision-makers connect what the evidence shows to the choices before them. A poll may clarify which concerns merit attention or help leaders assess how a message is received. It doesn’t dictate one response. Its value comes from interpreting findings in light of the organization’s goals, the audience it needs to reach, and the decision at hand.
That connection is central to how to present polling data to stakeholders. SMG provides public opinion polling that can include surveys, focus groups, and data analysis. These research tools help organizations understand public sentiment, while strategic communications carry relevant findings into clear, audience-aware messaging. Keep the transition traceable: identify the research result, explain the strategic interpretation, then present any recommendation as a recommendation, not as something respondents themselves said.
Connect public opinion findings to communications strategy
Use polling to inform message development, not to claim that the data prescribes a single line of communication. If a finding points to a concern stakeholders may need to address, consider how it affects message emphasis, supporting information, or the questions leaders should resolve. Recommendations should refer back to the evidence and retain its qualifications. SMG’s political messaging services connect message strategy to the work of communicating with an audience.
Prepare for a polling engagement or stakeholder briefing
Before planning research or a briefing, clarify the decision the work needs to inform. Identify the stakeholder groups, the timing of the decision, and the questions the research must address. This preparation aligns the scope of the discussion with what leaders need to understand, rather than producing findings without a clear strategic use.
SMG supports polling and strategic counsel across political and public-affairs environments. For a stakeholder briefing, define the decision, audience, and questions the research should address. Those same considerations help frame a polling project and show how its findings may inform strategy. The goal is a grounded discussion of the work, not a predetermined conclusion.
Whether the next step is refining a briefing or exploring public opinion research, keep the intended decision at the center. Discuss a polling project with SMG to consider how research and strategic counsel can support your organization’s needs.
Put the next decision within reach
A stakeholder briefing can do more than report public opinion. It can establish a shared basis for deciding what to examine, how to communicate, and where leadership should focus next. Treat the poll as a tool for better judgment, not a substitute for it. That principle makes how to present polling data to stakeholders a strategic discipline: keep decisions connected to evidence and recommendations accountable to what the research supports.
For organizations planning a briefing or considering polling, SMG brings experience in more than 40 states. Focus the next step on the decision at hand, the audience that needs insight, and the questions research could help address.
Discuss a polling project with SMG and shape a clear path from public opinion to informed action.
Frequently Asked Questions
How many slides should a polling presentation have?
Use only as many slides as the audience needs to understand the decision and discuss it. There’s no universal slide count: a short leadership meeting may call for a compact deck, while a workshop may need room for additional questions and comparisons. Set a limit based on the meeting agenda, then move detailed tables and secondary analyses to an appendix so they’re available without crowding the main presentation.
Should I include the poll's methodology in a stakeholder presentation?
Yes. Include enough methodology for stakeholders to assess what the findings represent. A concise note can identify the population surveyed, field dates, sample size, and data collection approach, using the poll’s documented details. For example, a poll of registered voters should not be presented as a measure of all residents. Put essential context near the findings, and keep fuller technical documentation available for participants who need to examine the research closely.
What should I do if stakeholders disagree with the polling results?
Ask what specifically they dispute: the survey question, the sample, the result, or its strategic meaning. Then check that concern against the research record and clarify any factual misunderstanding. If the disagreement is about what action to take, treat it as a decision discussion rather than a reason to reinterpret the result. In a discussion of how to present polling data to stakeholders, this distinction helps preserve trust and keep deliberation productive.
Can I present subgroup polling results to stakeholders?
Yes, if the poll’s design and subgroup data support a responsible interpretation. Before showing a breakdown, check the subgroup’s size and whether the research documentation supports reporting that estimate. Avoid treating a small difference between groups as meaningful simply because it appears in a chart. If a subgroup result is too uncertain to guide action, state that clearly and use the overall finding for the decision instead.
How should I explain a poll result that does not show a clear majority?
Describe the distribution accurately rather than forcing the result into a winner-or-loser story. If responses are divided, explain which options received support and whether a substantial share selected another response, such as uncertainty or no opinion. Keep the wording aligned with the question and avoid calling a narrow lead a consensus. Stakeholders can then consider what the division means for their decision without overstating public agreement.
Is a polling presentation different from a written polling report?
Yes. A presentation is designed to guide a live discussion, so it prioritizes the findings most relevant to the meeting and gives participants a clear way to respond. A written report can preserve fuller detail, including question wording, tables, and supporting documentation, for readers who need to review the research independently. Use both when appropriate: the presentation supports deliberation, while the report serves as a durable reference.
Comments