
How to Analyze Polling Data: A Strategic Guide for Political Success in 2026
- lionelleach
- 2 days ago
- 12 min read

Most political campaigns treat a poll like a static snapshot of the present, but seasoned strategists know that raw numbers are actually a blueprint for future intervention. With 435 House seats and 35 Senate seats contested in the 2026 midterms, the ability to discern signal from noise is the difference between a victory speech and a concession. Understanding how to analyze polling data requires more than just reading a spreadsheet; it demands a sophisticated grasp of technical validity and voter sentiment. You've likely felt the weight of raw data spreadsheets that seem more like obstacles than assets. It's common to wonder if a narrow margin of error renders your findings useless or if you're overlooking the specific voter segments that could tip the scales.
We've witnessed many leaders struggle to bridge the gap between statistical output and strategic execution. This guide provides the professional framework you need to transform raw survey numbers into actionable political intelligence and winning campaign strategies. You'll learn to identify a clear path to victory by isolating high-impact subgroups and verifying data quality against the latest standards, including the 2026 AAPOR ethical revisions regarding artificial intelligence. We'll examine how to craft messaging that resonates with precise demographics while ensuring your research stands up to the most rigorous technical scrutiny.
Key Takeaways
Move beyond "horse race" headlines to uncover the core motivations that dictate how different voter groups will actually behave on Election Day.
Learn how to analyze polling data through the lens of crosstabs and demographic weighting to ensure your strategy is built on statistically valid foundations.
Identify your specific "Path to Victory" by segmenting the electorate into actionable categories of base supporters and persuadable targets.
Transform raw data into a winning narrative by utilizing message testing to isolate the wedge issues that can dismantle your opponent’s coalition.
Mitigate the risks of internal confirmation bias by applying a seasoned insider’s perspective to the hidden mechanics of public sentiment.
Table of Contents
Beyond the Topline: Why Strategic Polling Analysis Matters in 2026
The Technical Foundation: How to Read Crosstabs and Weighted Data
Identifying the Path to Victory: Voter Segmentation Analysis
From Data to Narrative: Translating Polls into Political Messaging
The Seasoned Insider Advantage: Why Professional Analysis Trumps Raw Data
Beyond the Topline: Why Strategic Polling Analysis Matters in 2026
Political polling analysis is the rigorous process of identifying underlying voter motivations rather than simply tracking candidate preferences. While basic reporting tells you who is currently leading, strategic analysis reveals why voters are shifting their allegiances. In the high stakes environment of the 2026 midterms, relying on a snapshot in time is a recipe for failure. You need to understand what are opinion polls in their most complex form: tools for voter reengagement and tactical planning.
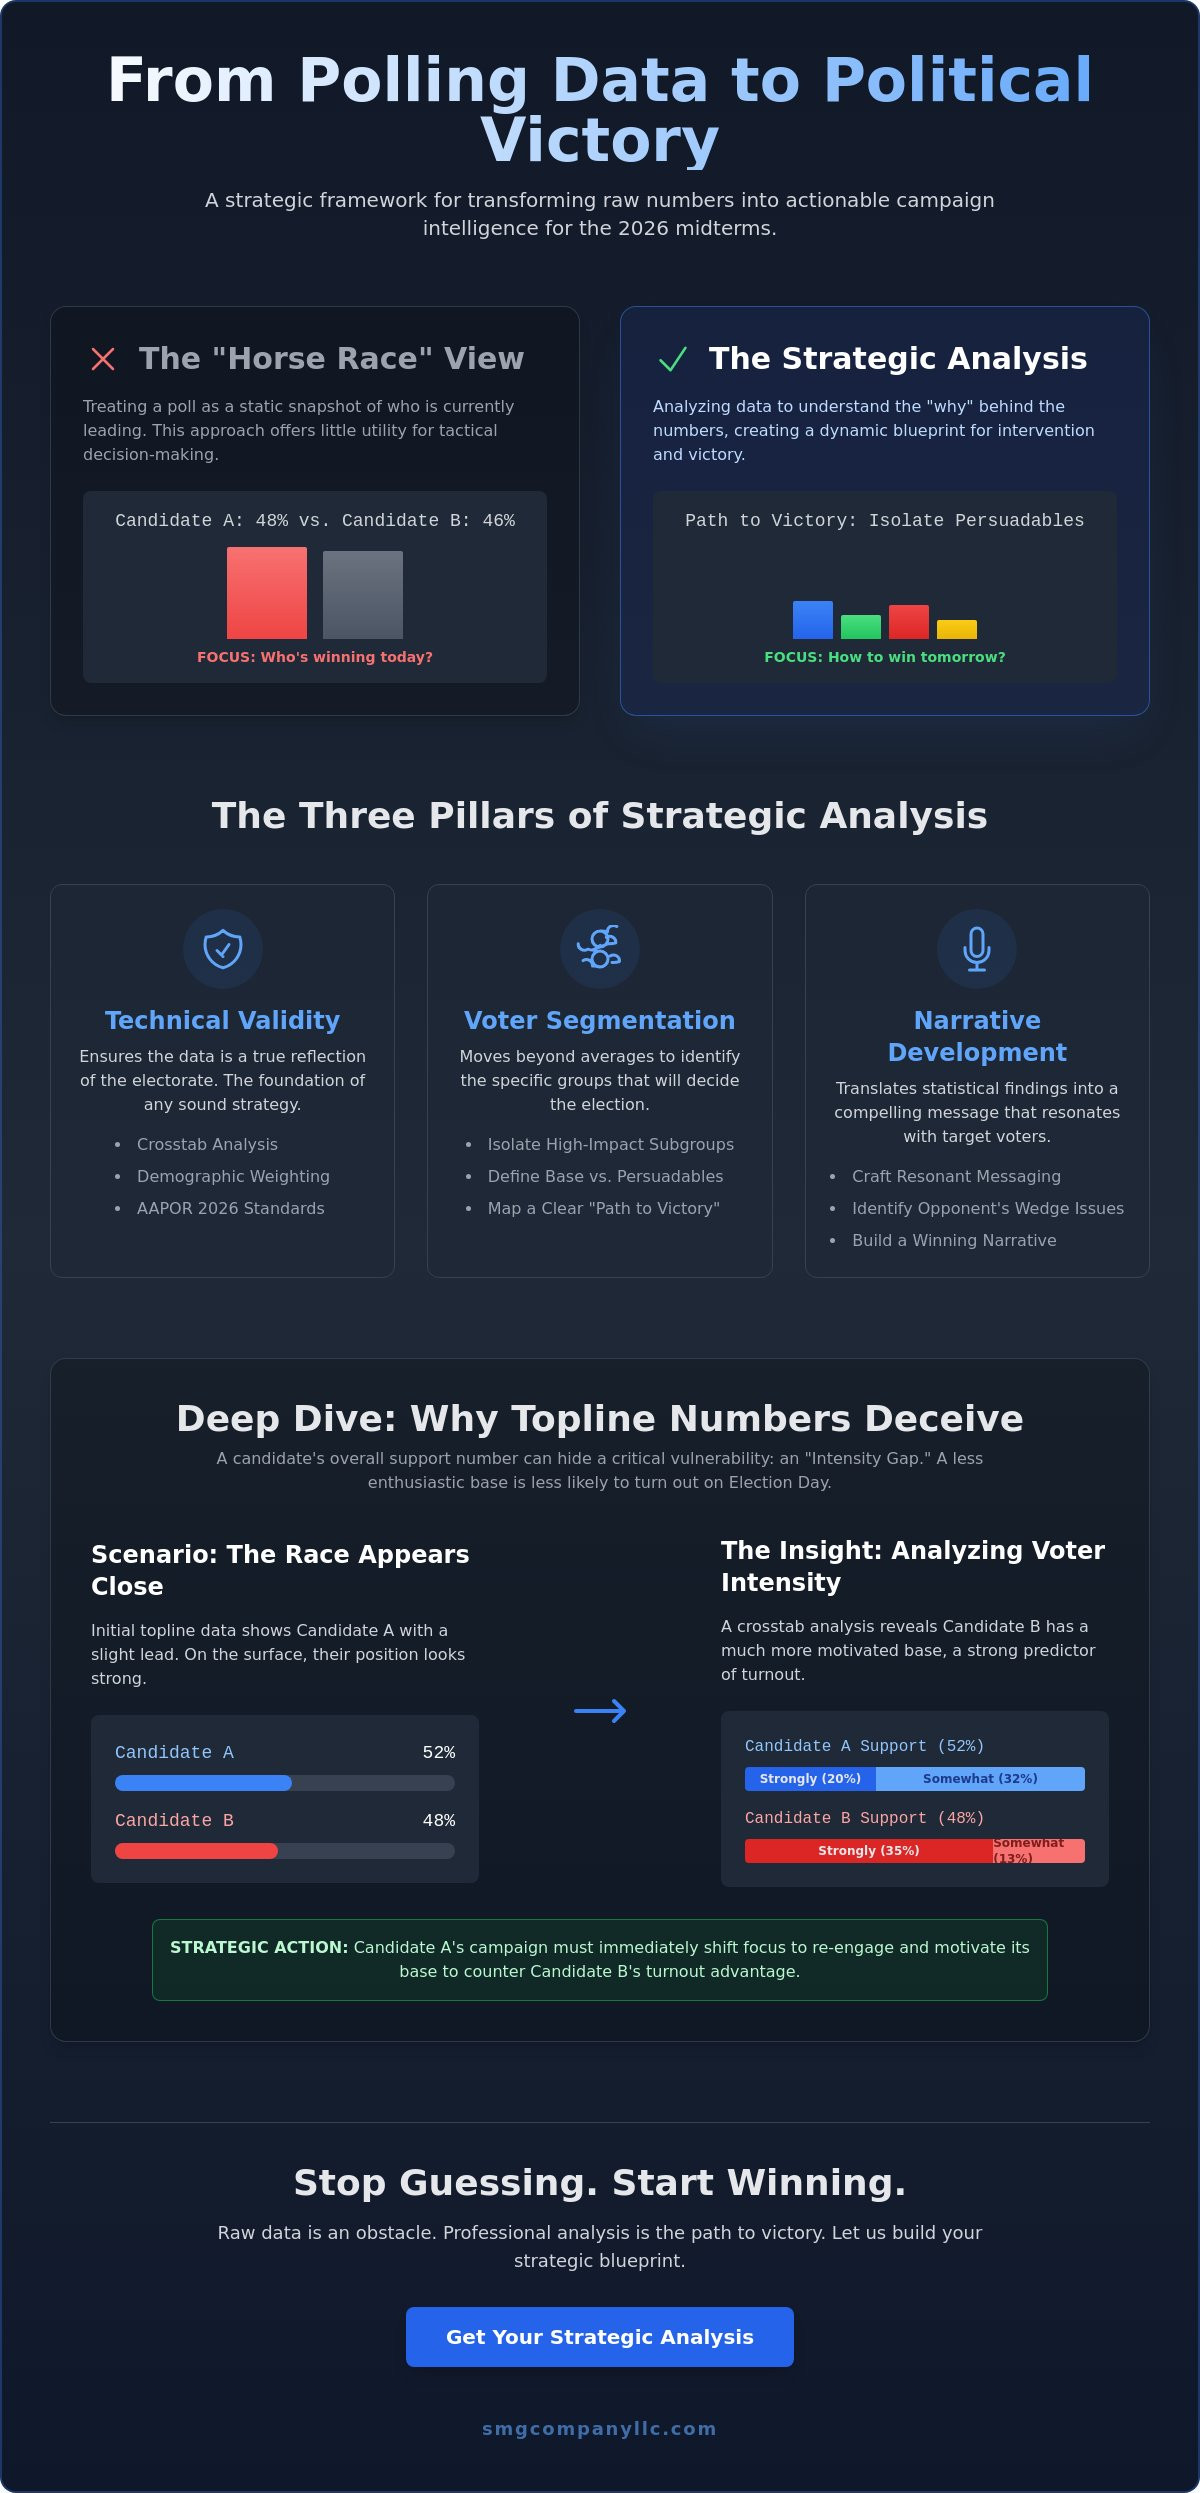
Most campaigns fixate on topline results, often referred to as the horse race. These numbers are easily digestible but offer little utility for tactical decision making. Deep dive strategic data goes much further by uncovering the specific drivers of public sentiment. This is where public opinion polling services provide the necessary actionable intelligence to pivot a campaign in real time. Mastering how to analyze polling data means looking past the surface to find the levers of influence that actually move the needle.
To better understand how these numbers translate into strategy, watch this overview of data interpretation:
The Difference Between Reading and Analyzing
Reading a report tells you who's winning today. Analysis tells you how to win tomorrow. It requires a commitment to three specific pillars: technical validity, demographic segmentation, and narrative development. Validity ensures the sample reflects reality. Segmentation identifies which groups are moveable. Narrative translates those findings into a message that sticks. Strategic analysis is the bridge between data and victory.
The Role of Electorate Analysis
Raw poll numbers exist in a vacuum without historical context. This is why electorate analysis is the essential foundation for any current research. For instance, analyzing likely voters in a state like New Jersey requires localized geographic weighting that accounts for specific regional turnout patterns and historical shifts. Without this context, you aren't conducting an analysis; you're just guessing. Learning how to analyze polling data correctly involves marrying today's sentiment with the hard realities of previous election cycles.
The Technical Foundation: How to Read Crosstabs and Weighted Data
Raw data is a liability if you don't possess the technical rigor to interpret it. While topline numbers offer a cursory glance at the electorate, the real strategic value lies within the crosstabulations. Mastering how to analyze polling data requires a transition from observing general trends to dissecting specific demographic behaviors. This technical foundation ensures that your campaign strategy is built on a bedrock of statistical reality rather than optimistic assumptions.
Mastering the Crosstabulation
A crosstab is the anatomy of your survey, placing demographic variables like age, gender, and party ID in direct conversation with issue priorities. To identify an intensity gap, you must look beyond who supports a candidate and analyze the strength of that support. "Strongly favor" responses are far more predictive of actual voter turnout than "somewhat favor" sentiments. In the 2026 cycle, we're seeing the rise of mobile-integrated data sets which allow for faster, more granular reporting. These digital-first methods help identify outlier subgroups, such as emerging youth cohorts or shifting suburban blocks, that traditional landline-only polls often miss. By comparing these segments, you can spot trends before they become mainstream narratives.
Weighting and Validity Checks
Unweighted data is the primary cause of political polling accuracy issues. If your sample doesn't mirror the actual census or voter file demographics of the region, your results are functionally useless. Weighting corrects these imbalances, ensuring that a survey of 600 people accurately represents the diversity of the 40+ states SMG operates in. The role of political analytics in polling is to verify that the sample size (N) for any given subgroup is large enough to maintain a 95% confidence level. For instance, when looking at a specific segment like Newark swing voters, the margin of error increases significantly as the subgroup size shrinks. You must distinguish between a statistically significant shift and mere statistical noise to avoid chasing ghosts in the data.
Establishing this level of technical precision is a complex task that requires an experienced eye. If you're ready to move beyond basic spreadsheets, consider partnering with a professional polling partner who understands the hidden mechanics of influence. Knowing how to analyze polling data is the first step; applying it with precision is what secures the win.
Identifying the Path to Victory: Voter Segmentation Analysis
A path to victory isn't a vague hope; it's a calculated combination of voter groups that reaches the 50% plus one threshold. When you understand how to analyze polling data, you stop treating the electorate as a monolith. You begin to see the distinct layers: the hard base, the persuadable middle, and the opposition. This segmentation allows a campaign to allocate resources with surgical precision, ensuring that no effort is wasted on voters who are either already locked in or entirely unreachable.
The hard base provides your floor, but the persuadables provide your ceiling. Analyzing the undecided pool requires identifying quiet partisans. These are individuals who may refuse to name a candidate during a survey but exhibit issue priorities that align perfectly with one camp. In New Jersey elections, geographic segmentation is vital. A voter in Bergen County often prioritizes different economic levers than one in Atlantic County. By isolating these regions in your data, you can develop localized strategies that resonate with the specific concerns of each community.
Finding the Swing Vote
Persuadable voters often show high favorability for both candidates, making them the most volatile segment of the electorate. You can use the "Second Choice" question in your survey to determine your candidate’s growth potential and identify which voters are truly up for grabs. These soft partisans are the primary targets for digital advertising for campaigns. When your data identifies a subgroup that is leaning toward your opponent but shares your candidate's stance on a key issue, you've found a wedge that can be exploited through targeted digital messaging.
Base Mobilization vs. Persuasion
Data dictates whether you need a turnout strategy or a conversion strategy. High enthusiasm scores among your base suggest you've already won the argument; you just need them to show up on Election Day. Lower scores indicate a persuasion problem that requires a shift in narrative. Technical guides such as How to Analyze ANES Survey Data offer rigorous methods for evaluating these turnout models and calculating sampling errors. Mastering how to analyze polling data means knowing when to stop talking to the middle and start energizing the core to ensure they actually cast their ballots.
From Data to Narrative: Translating Polls into Political Messaging
Raw data identifies the target; the narrative captures them. Once you understand the technical foundation and the path to victory, the focus shifts to communication. Effective messaging isn't born from intuition; it's forged through empirical testing. Knowing how to analyze polling data provides the evidence needed to determine which arguments will resonate and which will fall flat. This stage of the process transforms statistical probabilities into a compelling story that moves voters to action.
Strategic messaging requires ranking issue priorities through message testing polls. You aren't just looking for what voters like; you're looking for what they prioritize above all else. This data also reveals wedge issues, those specific topics that can peel away soft support from an opponent. By testing negative and positive framing, you can measure voter resilience. You'll discover if a specific attack will stick or if a positive vision is strong enough to withstand the inevitable counter-messaging. A candidate narrative built on voter perceived strengths is far more durable than one based on consultant whims.
Developing the Strategic Message
Creating a narrative that wins requires a disciplined three step approach. First, identify the top three concerns of your target swing segment. These concerns act as the anchor for every speech and advertisement. Second, map those concerns directly to the candidate’s legislative record or platform to establish authenticity. Finally, use the data to draft a "Response to Attack" that addresses your candidate’s least defensible points before the opposition can exploit them. This proactive stance ensures you control the narrative rather than reacting to it. Understanding how to analyze polling data allows you to predict where the hits will come from and prepare the shield accordingly.
Deploying Digital and Mobile Insights
Modern campaigns rely on the integration of data and delivery. Your analysis should directly inform your political messaging services, ensuring that digital ads are served to the right people at the right time. For example, if the data shows a sudden spike in concern over local infrastructure in a specific district, that is the moment to deploy mobile assets like the SMG Video Truck to that exact neighborhood. This precision ensures your message is not just heard, but felt where it matters most. Using data to time these deployments maximizes the impact of every dollar spent on the ground. If you need a partner to translate your data into a winning campaign, contact our strategic team today to build your path to victory.
The Seasoned Insider Advantage: Why Professional Analysis Trumps Raw Data
Internal campaign teams often fall victim to confirmation bias, a psychological trap where analysts subconsciously prioritize data that supports their existing strategy. When stakeholders are emotionally invested in a specific outcome, they tend to overlook red flags in the crosstabs or dismiss shifts in sentiment as statistical noise. Professional analysis provides the disruptive lens necessary to challenge these assumptions. A firm that understands the hidden mechanics of influence doesn't just report numbers; it interprets them within the broader context of institutional power and social trends. This objective distance ensures that your strategy remains rooted in reality rather than optimism.
Strategic success in 2026 requires the seamless integration of research with broader government relations strategy. Polling doesn't exist in a vacuum. It serves as the foundation for navigating complex systems of governance and public sentiment. When you master how to analyze polling data from a professional standpoint, you gain the ability to predict how legislative shifts will impact voter behavior months before the opposition reacts. This level of foresight allows you to build a path to victory where others only see obstacles. It's the difference between reacting to the news cycle and actively shaping it through sophisticated messaging and tactical positioning.
Avoiding the Amateur Trap
Amateur campaigns frequently rely on unscientific samples or "Internet polls" that lack the rigorous weighting necessary for accuracy. These methods are catastrophic, often leading to a total misallocation of resources in the final weeks of a contest. Relying on flawed data creates a false sense of security that evaporates on Election Day. Seasoned authority is the only cure for data-driven anxiety. An external partner brings a grounded, respectful focus to the research, ensuring that every insight is backed by technical validity and a history of high-stakes success. Without this professional oversight, you're not running a campaign; you're taking a gamble.
Partnering for Victory
SMG manages high-stakes political contests across 40+ states, utilizing a methodical approach that prioritizes efficiency and precision. We understand the synergy between public opinion polling, digital media, and field operations. Our analysis informs everything from speech writing to the timing of voice and text broadcasting, ensuring a unified front across all communication channels. Data is the compass that points toward the target, but the strategic architect builds the road that leads to the win. If you're ready to transform your research into a formidable tool for leadership, contact SMG today for professional electorate analysis and polling strategy. Knowing how to analyze polling data is only the beginning; executing a plan based on those insights is what secures your place in the winner’s circle.
Building Your Blueprint for Victory
Winning in 2026 requires a departure from traditional, passive data interpretation. You've seen that understanding how to analyze polling data is not about reading a scoreboard; it's about identifying the specific demographic levers that move an entire electorate. By prioritizing technical validity and rigorous voter segmentation, you transform raw numbers into a narrative that resonates with the persuadable middle while energizing your core base. This methodical approach ensures your resources are deployed where they'll have the greatest impact.
The path to political success is rarely found in a vacuum. It demands the integration of research with innovative digital media and mobile advertising strategies that meet voters where they are. With strategic experience in over 40 states and a proven track record ranging from local mayors to the halls of Congress, our team understands the gravity of leadership and the precision required for high-stakes contests. Don't leave your campaign's future to chance or amateur interpretation. Partner with the Strategic Architects at SMG for Your Next Campaign and leverage the deep-rooted expertise that turns data into a road to victory. Your vision for community leadership deserves a strategy built on institutional influence and seasoned confidence.
Frequently Asked Questions
How do I know if my polling data is actually accurate?
Accuracy is determined by the rigor of the methodology and how well the sample reflects the actual electorate. You must verify that the demographic weighting matches the most recent voter file or census data for your specific district. A reputable poll will provide a transparent methodology statement and a margin of error that accounts for the sample size. If the data isn't weighted correctly, it's merely a collection of opinions rather than a strategic tool.
What is the most important part of a political poll to analyze first?
You should look at the "right direction vs. wrong track" and issue priority questions before the candidate horse race. These metrics reveal the underlying mood of the electorate and the environment in which the campaign exists. Understanding the primary concerns of voters allows you to contextualize the candidate's standing. It's the essential first step in determining how to analyze polling data to build a narrative that actually moves the needle.
How many people do I need to survey for a local Newark election?
A local Newark election typically requires a sample size of 300 to 400 likely voters to achieve a manageable margin of error. While larger samples provide more granularity for subgroup analysis, this range offers a reliable snapshot of the city's diverse wards. It's vital to ensure the sample is geographically distributed across all five wards to account for localized political shifts and historical turnout patterns.
Can I analyze polling data using standard spreadsheet software?
You can use standard spreadsheet software for basic data entry, but it often lacks the sophisticated tools required for complex weighting and automated crosstabulation. Professional analysts use specialized statistical software to ensure demographic accuracy and to run multi-variable regressions. If you rely on basic spreadsheets, you risk missing the subtle nuances and intensity gaps that define a winning strategy in a high-stakes environment.
What is the difference between a benchmark poll and a tracking poll?
A benchmark poll is a comprehensive survey conducted at the start of a campaign to establish the political landscape and identify issue priorities. In contrast, a tracking poll consists of smaller, continuous samples designed to monitor shifts in voter sentiment over a specific period. The benchmark provides the strategic foundation; the tracking polls allow you to observe the real-time impact of your messaging and events.
How do I identify a "swing voter" in my crosstabs?
Swing voters are identified in crosstabs by their lack of strong favorability for either candidate and their tendency to select "somewhat" or "undecided" options. You should also look for individuals who align with your candidate on top-tier issues but haven't committed to a vote. These soft partisans represent the most fertile ground for persuasion through targeted digital and mobile advertising efforts during the final weeks of the cycle.
What happens if the polling data contradicts my campaign strategy?
If the data contradicts your strategy, you must pivot your messaging to address the reality of voter sentiment. Fighting the data is a catastrophic mistake that leads to wasted resources and a failed candidacy. A professional analysis will identify the specific disconnect between your platform and public opinion. Use these insights to refine your narrative and focus on the issues that the electorate actually prioritizes.
How often should a campaign analyze new polling data?
The frequency of analysis depends on the stage of the election cycle and the volatility of the race. A campaign should conduct a benchmark early, followed by periodic message testing as the landscape shifts. In the final sixty days, tracking polls should be analyzed weekly or even daily to catch late-breaking trends. Learning how to analyze polling data with this level of frequency allows you to respond to opponent attacks with precision.
Comments